For optimal reading, please switch to desktop mode.

For many reasons, it is common for HPC users of OpenStack to use Ironic and Nova together to deliver baremetal servers to their users. In this post we look at recent changes to how Nova chooses which Ironic node to use for each user's nova boot request.
SKA SDP Performance Prototype
As part of the development of the SKA, StackHPC has created an OpenStack based cloud that researchers can use to prototype how best to process the data output from the telescopes. For this discussion of managing cloud capacity, the key points to note are:
- Several types of nodes: Regular, a few GPU nodes, a few NVMe nodes, some high memory nodes.
- Several physical networks, including 10G Ethernet, 25G Ethernet and 100Gb/s Infiniband.
- A globally distributed team of scientists.
- Some work will need exclusive use of the whole system, to benchmark the performance of prototype scientific pipelines.
Managing Capacity
Public cloud must present the illusion of infinite capacity. For private cloud use cases, and research computing in particular, the amount of available, unused capacity is of great interest. Most small clouds soon hit the reality of running out of space. There are two main approaches to dealing with capacity problems:
- Explicit assignment (and pre-emption)
- Co-operative multitasking
Given our situation described above, we have opted for co-operative multitasking, where the users delete their own instances when they are finished with those nodes, allowing others to do what they need.
To help reduce the strain on resources we are also prototyping having a shared execution frameworks such as a Heat provisioned OpenHPC Slurm cluster, a Magnum provisioned Docker Swarm cluster and a Sahara provisioned RDMA enabled Spark cluster from HiBD.
In this blog we are focusing on the capacity of Ironic based clouds. When you add virtualisation into the mix, there are many questions around how different combinations of flavors fit onto a single hypervisor, how to try to avoid wasted space. Similarly, we are focusing on statically sized private clouds, so this blog will ignore the whole world of capacity planning.
OpenStack Security Model
You can argue about this being a security model, or just the details of the abstraction OpenStack presents, but the public APIs try their best to hide any idea of physical hosts and capacity from non-cloud-admin users.
When building a public cloud as a publicly traded company, exposing via the API in realtime how many physical hosts you run or how much free capacity you have could probably break the law in some countries. But when you run a private could, you really want a nice view of what your friends are using.
Co-operative Capacity Management
"Play nice, or I will delete all your servers every Friday afternoon!"
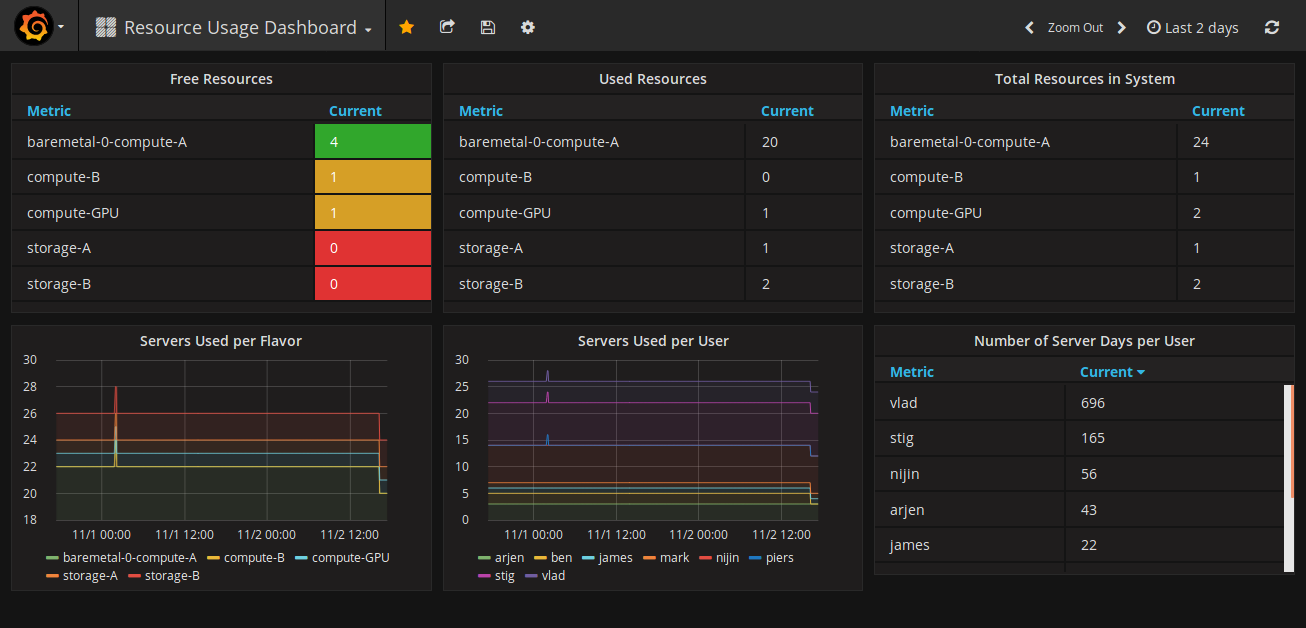
That is a very tempting thing to say, and I basically have said that. But its hard to play nice when you have no idea how much capacity is in use. So we have a solution: the capacity dashboard.

Talking to the users of P3, its clear having a visual representation of who is currently using what has been much more useful that a wiki page of requests that quickly drifted out of sync with reality. In the future we may consider Mistral to enforce lease times of servers, or maybe Blazar for a more formal reservation system, but for now giving the scientists the flexibility of a more informal system is working well.
Building the Dashboard
Firstly we have our monitoring infrastructure. This is currently built using OpenStack Monasca, making use of Kafka and Influx DB. (We also use Monasca with ELK to generate metrics from our logs, but that is a story for another day):
The dashboard is built using Grafana. There is a Monasca plugin, that means we can use the Monasca API as a data source, and a Keystone plugin that is used to authenticate and authorise access to both Grafana and its use of the Monasca APIs: https://grafana.com/plugins/monasca-datasource
Our system metrics are kept in a project general users don't have access to, but the capacity metrics and dashboards are associated with the project that all the users of the system have access to.
Now we have a system in place to ingest, store, query and visualize metrics in a multi-tenant way, we now need a tool to query the capacity and send metrics into Monasca.
Querying Baremetal Capacity
We have created a small CLI tool called os-capacity. It uses os_client_config and cliff to query the Placement API for details about the current cloud capacity and usage. It also uses Nova APIs and Keystone APIs to get hold of useful friendly names for the information that is in placement.
For the Capacity dashboard we use data from two particular CLI calls. Firstly we look at the capacity by calling:
os-capacity resources group
+----------------------------------+-------+------+------+-------------+
| Resource Class Groups            | Total | Used | Free | Flavors     |
+----------------------------------+-------+------+------+-------------+
| VCPU:1,MEMORY_MB:512,DISK_GB:20  |     5 |    1 |    4 | my-flavor-1 |
| VCPU:2,MEMORY_MB:1024,DISK_GB:40 |     2 |    0 |    2 | my-flavor-2 |
+----------------------------------+-------+------+------+-------------+
This tool is currently very focused on baremetal clouds. The flavor mapping is done assuming the flavors should exactly match all the available resources for a given Resource Provider. This is clearly not true for a virtualised scenario. It is also not true in some baremetal clouds, but this works OK for our cloud. Of course, patches welcome :)
Secondly we can look at the usage of the cloud by calling:
os-capacity usages group user --max-width 70
+----------------------+----------------------+----------------------+
| User                 | Current Usage        | Usage Days           |
+----------------------+----------------------+----------------------+
| 1e6abb726dd04d4eb4b8 | Count:4,             | Count:410,           |
| 94e19c397d5e         | DISK_GB:1484,        | DISK_GB:152110,      |
|                      | MEMORY_MB:524288,    | MEMORY_MB:53739520,  |
|                      | VCPU:256             | VCPU:26240           |
| 4661c3e5f2804696ba26 | Count:1,             | Count:3,             |
| 56b50dbd0f3d         | DISK_GB:371,         | DISK_GB:1113,        |
|                      | MEMORY_MB:131072,    | MEMORY_MB:393216,    |
|                      | VCPU:64              | VCPU:192             |
+----------------------+----------------------+----------------------+
You can also group by project, but in the current SKA cloud all users are in the same project, so grouping by user works best.
The only additional step is converting the above information into metrics that are fed into Monasca. For now this has also been integrated into the os-capacity tool, by a magic environment variable. Ideally we would feed the json based output of os-capacity into a separate tool that manages sending metrics, but that is a nice task for a rainy day.
What's Next?
Through our project in SKA we are starting to work very closely with CERN. As part of that work we are looking at helping with the CERN prototype of preemptible instances, and looking at many other ways that both the SKA and CERN can work together to help our scientists be even more productive.
The ultimate goal is to deliver private cloud infrastructure for research computing use cases that achieves levels of utilisation comparable to the best examples of well-run conventional research computing clusters. Being able to track available capacity is an important step in that direction.