For optimal reading, please switch to desktop mode.
Recently there has been a resurgence of interest around the use of Ethernet for HPC workloads, most notably from recent announcements from Cray and Slingshot. In this article I examine some of the history around Ethernet in HPC and look at some of the advantages within modern HPC Clouds.
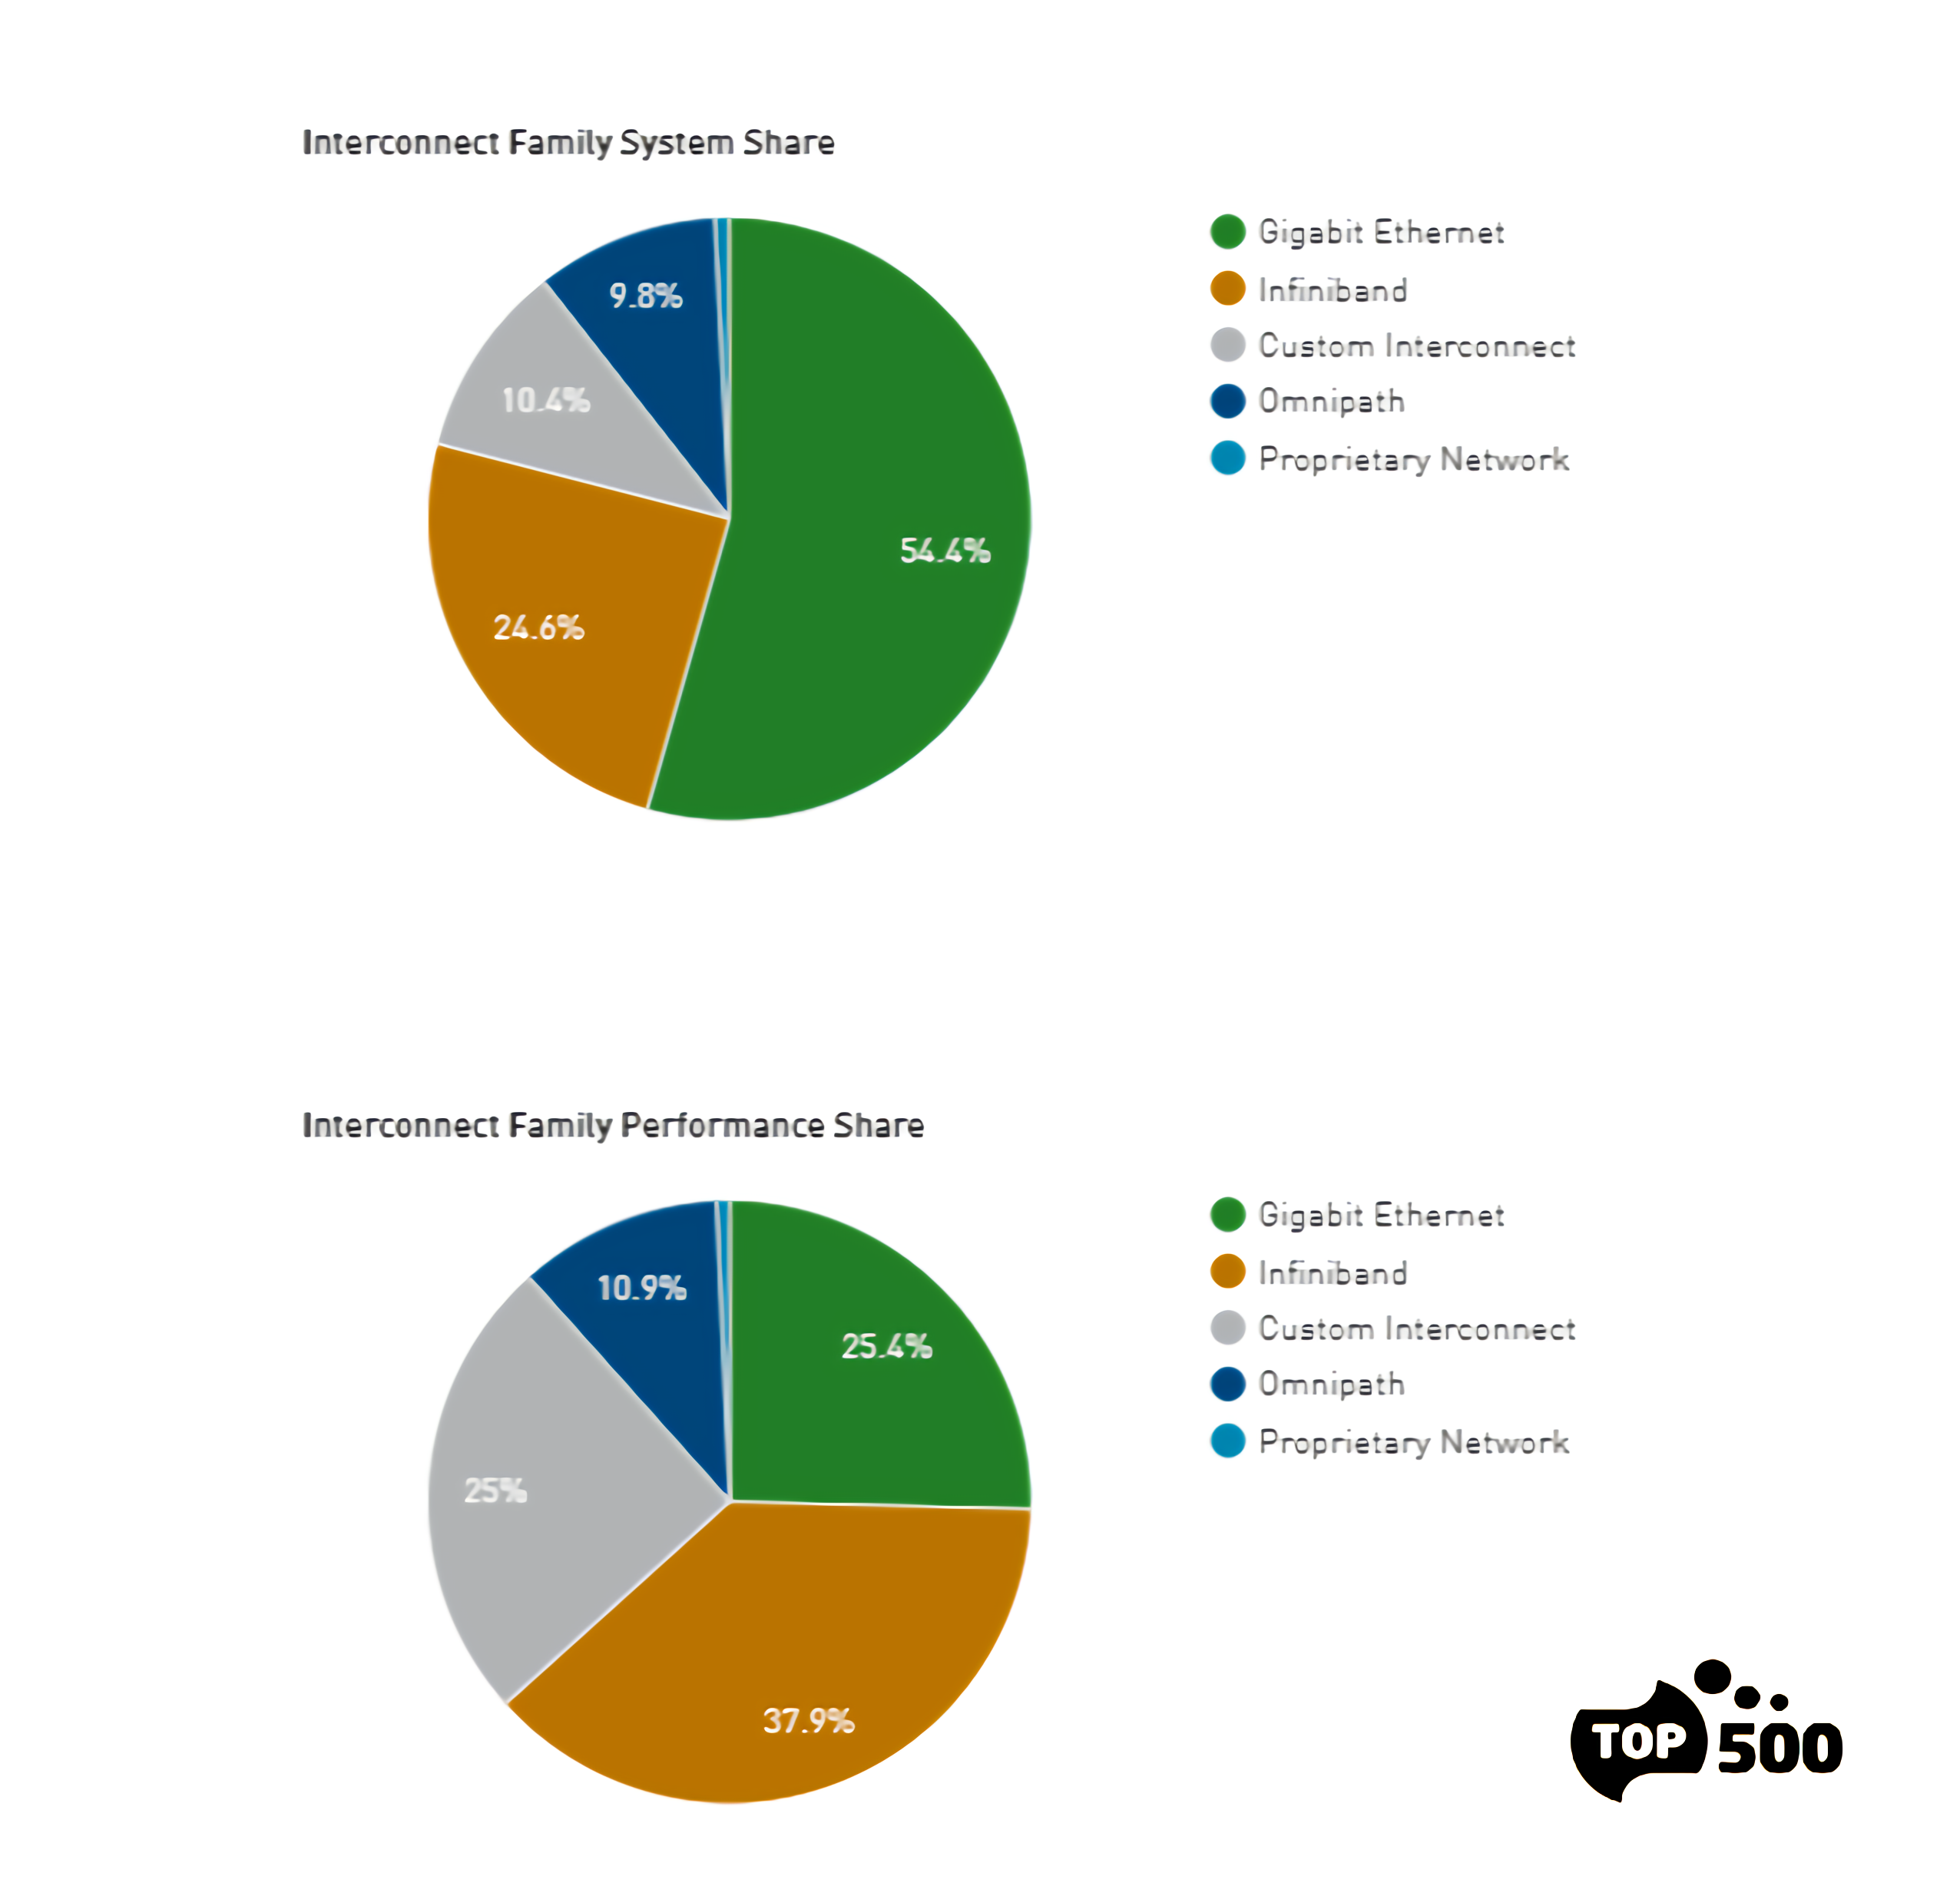
Of course Ethernet has been the mainstay of many organisations involved in High Throughput Computing large-scale cluster environments (e.g. Geophysics, Particle Physics, etc.) although it does not (generally) hold the mind-share for those organisations where conventional HPC workloads predominate, notwithstanding the fact that for many of these environments, the operational workload for a particular application rarely goes above a small to moderate number of nodes. Here Infiniband has held sway for many years now. A recent look at the TOP500 gives some indication of the spread of Ethernet vs. Infiniband vs. Custom or Proprietary interconnects for both system and performance share, or as I often refer to them as the price-performance and performance, respectively, of the HPC market.

My interest in Ethernet was piqued some 15-20 years ago as it is a standard, and very early on there were mechanisms to obviate kernel overheads which allowed some level of scalability even back in the days of 1Gbps. This meant even then, that one could exploit Landed-on-Motherboard network technology instead of more expensive PCI add-in cards, Since then as we moved to 10Gbps and beyond, and I coincidentally joined Gnodal (later acquired by Cray), RDMA-enablement (through RoCE and iWarp) allowed standard MPI environment support and with the 25, 50 and 100Gbps implementations, bandwidth and latency promised on par with Infiniband. As a standard we would expect a healthy ecosystem of players within both the smart NIC and switch markets to flourish. For most switches such support is now a standard (see next section). In terms of rNICs Broadcom, Chelsio, Marvel and Mellanox currently offer products supporting either, or both, the RDMA Ethernet protocols.
Pause for Thought (Pun Intended)
I think the answer to the question, on “are we there yet” is, (isn’t it always) going to be “it depends”. That “depends” will largely be influenced by the market segmentation into the Performance, Price-Performance and Price regimes. The question is can Ethernet address the areas of “Price” and “Price-Performance” as opposed to the “Performance Region” where some of the deficiencies of Ethernet RDMA may well be exposed, e.g. multi-switch congestion at large scale but for moderate sized clusters with nodes spanning only a single switch may well be a better fit.
So for example, a cluster of 128 nodes (minus nodes for management, access, storage): if it was possible to assess that 25GbE vs 100Gbps EDR was sufficient, then I can build a system from a single 32-port 100GbE Switch (using break-out cables) as opposed to multiple 36-port EDR switches, which if I take the standard practise of over-subscription, I would end-up with similar cross-sectional bandwidth to the single Ethernet switch anyway. Of course, within the bounds of a single switch the bandwidth would be higher for IB. I guess down the line with 400GbE devices coming to a Data Centre soon, this balance will change.
Recently I had the chance to revisit this when running test benchmarks on a bare-metal OpenStack system being used for prototyping of the SKA (I’ll come on to OpenStack a bit later on but just to remark here that this system runs OpenStack to prototype an operating environment for the Science Data Processing Platform of the SKA).
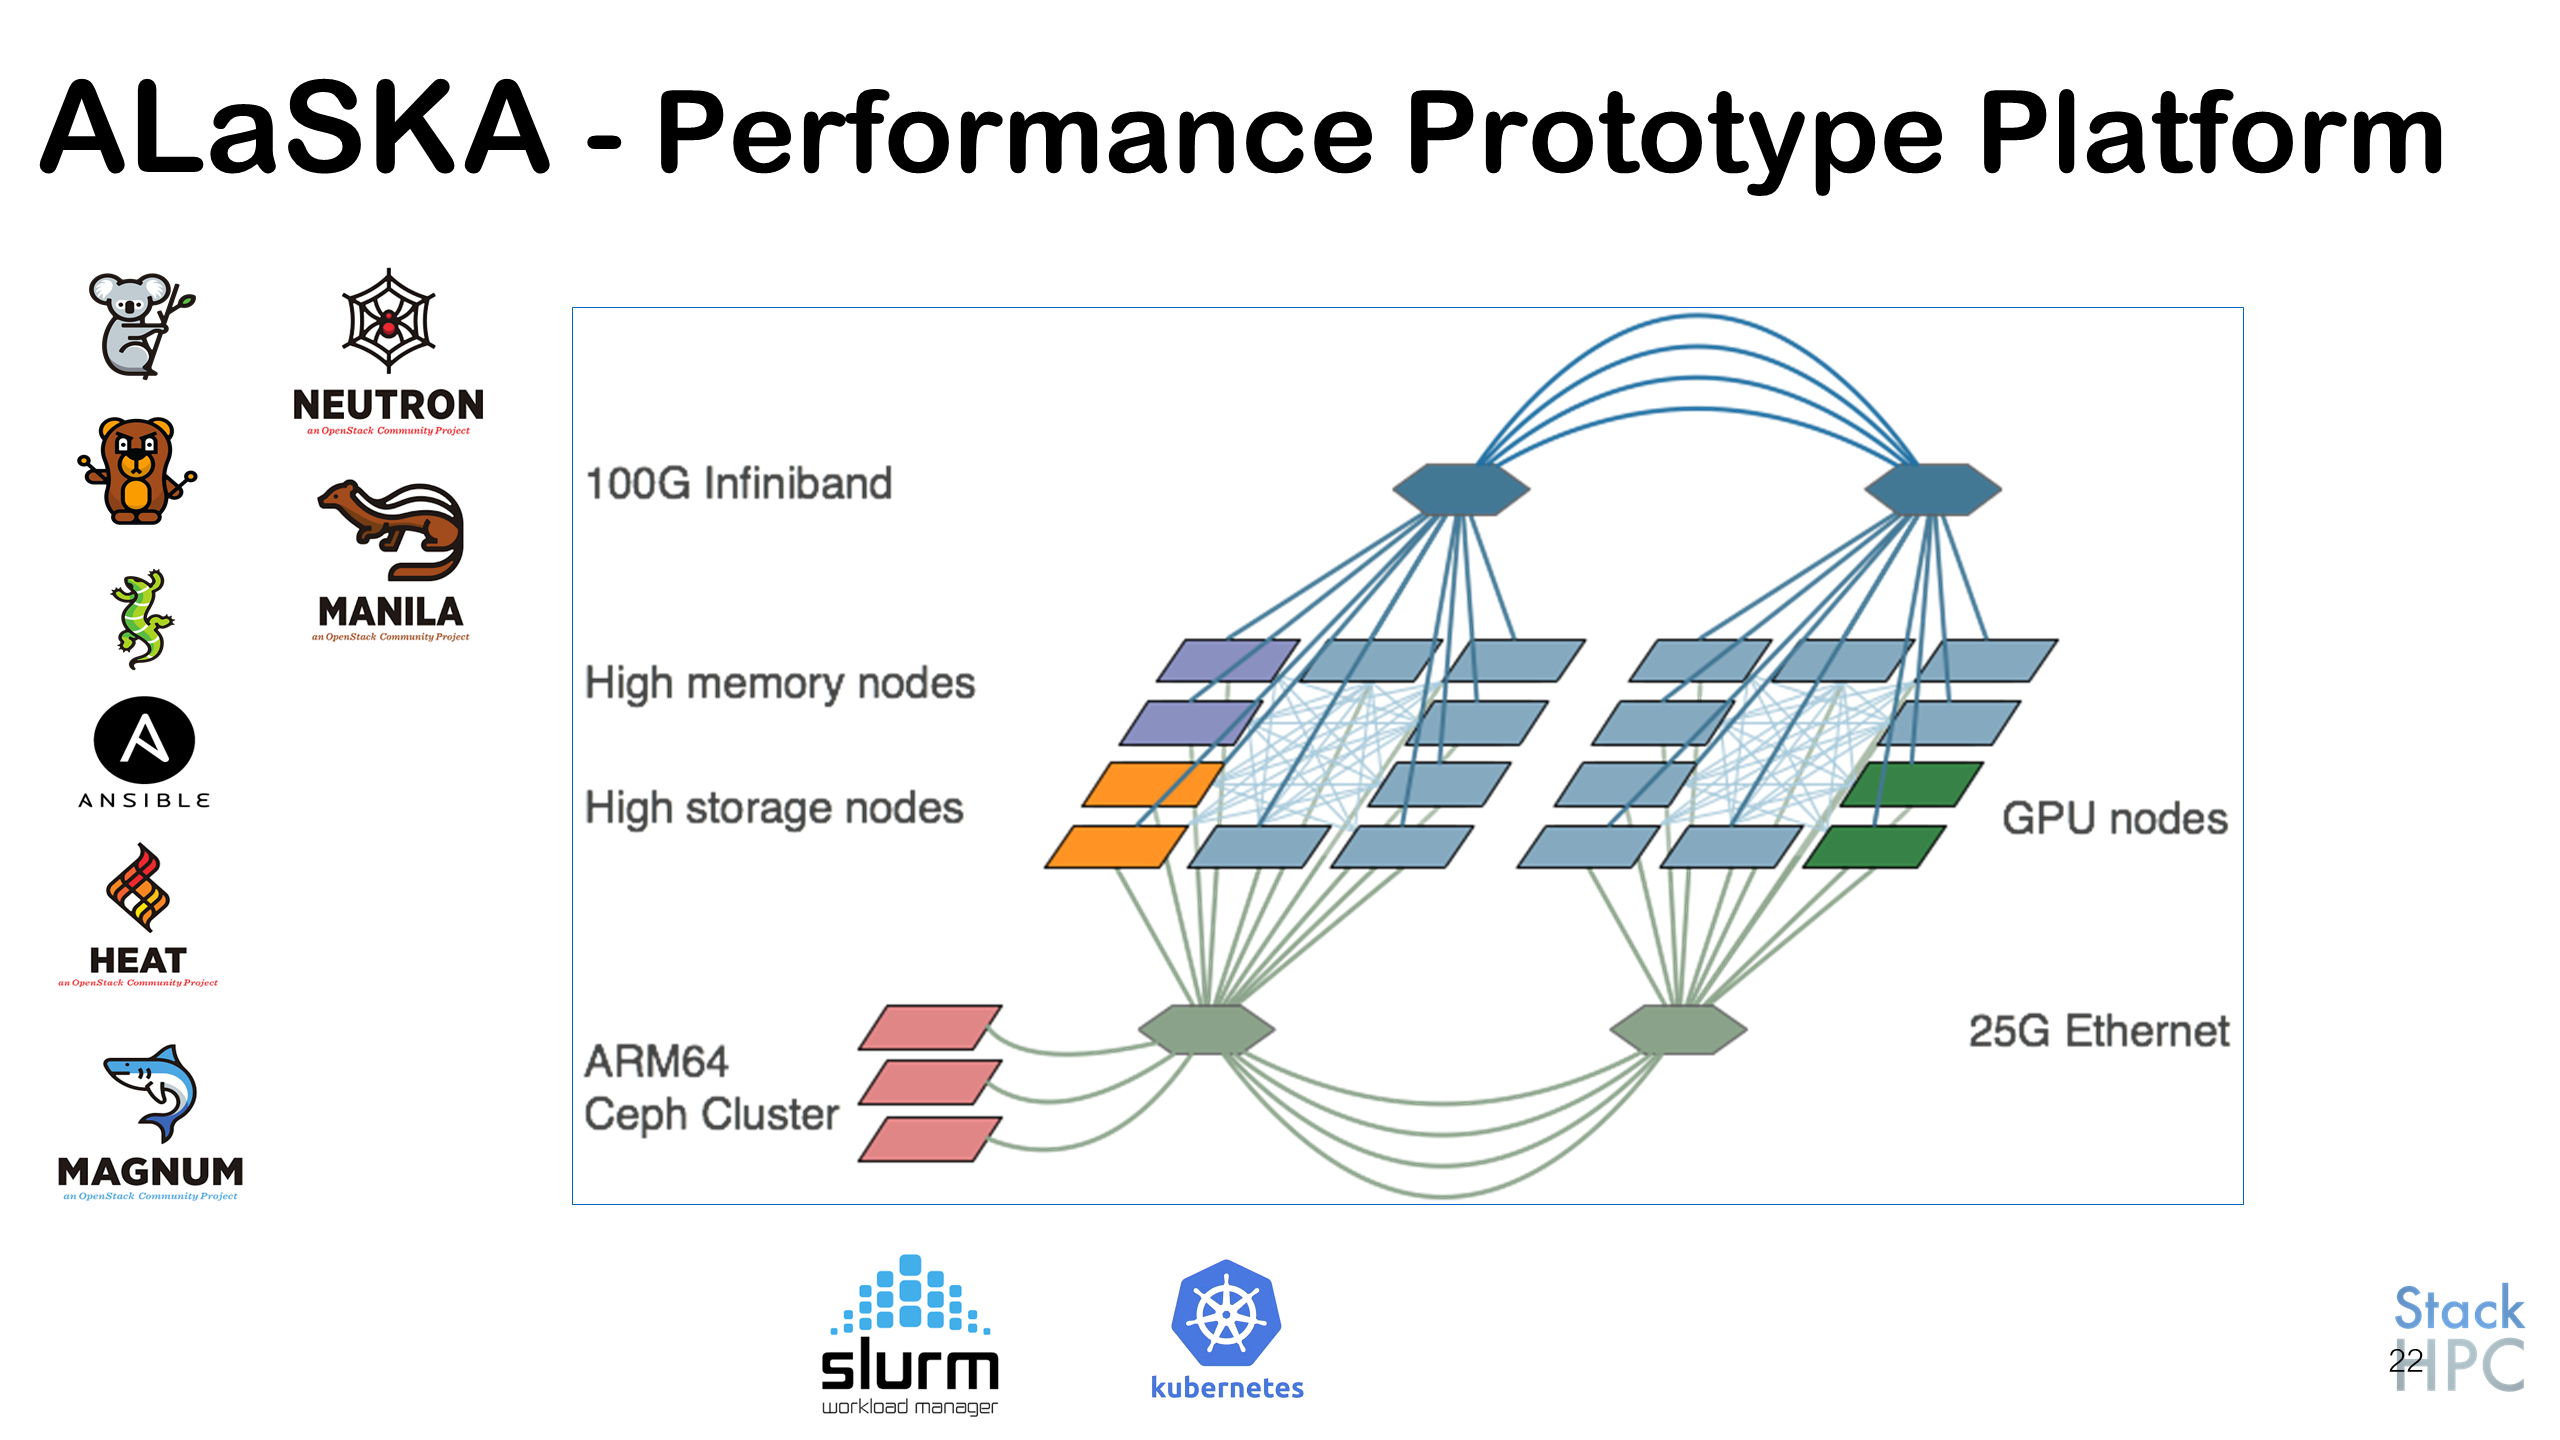
I wanted to stress-test the networks, compute nodes and to some extent the storage. StackHPC operate the system as a performance prototype platform on behalf of astronomers across the SKA community and so ensuring performance is maintained across the system is critical. The system, eponymously named ALaSKA, looks like this.

ALaSKA is used to software-define various platforms of interest to various aspects of the SKA-Science Data Processor. The two predominant platforms of interest currently are a Container Orchestration environment (previously Docker-Swarm but now Kubernetes) and a Slurm-as-a-Service HPC platform.
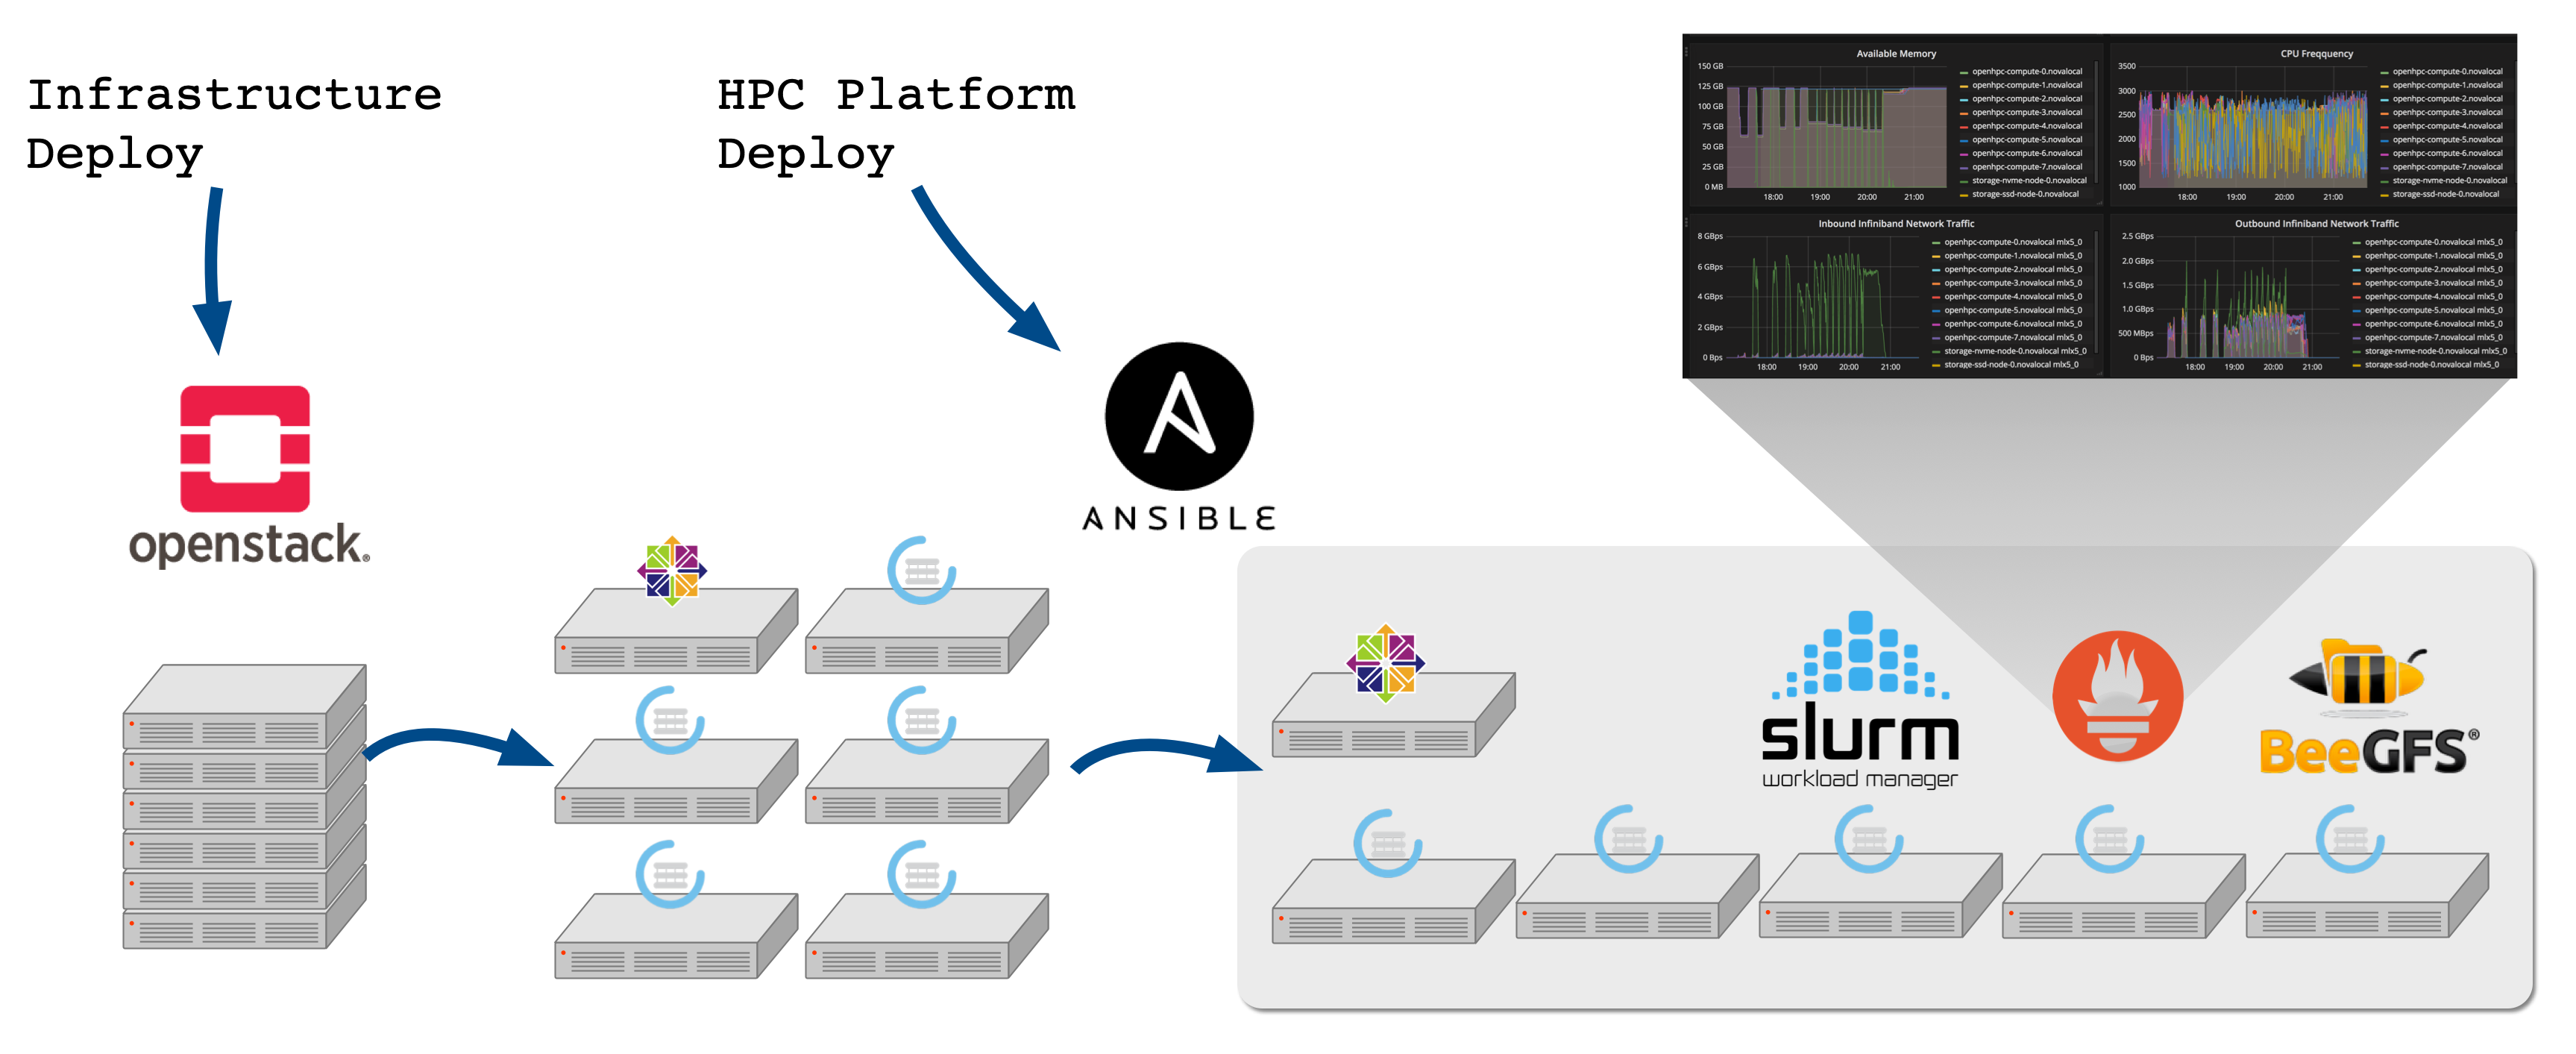
Here we focus on the latter of these, which gives us a good opportunity to look at 100G IB vs 25G RoCE vs 25Gbps TCP vs 10G (network not shown in the above diagram but is used for provisioning) to compare performance. First let us look more closely at the Slurm PaaS. From the base, compute, storage and network infrastructure we use OpenStack Kayobe to deploy the OpenStack control plane (based on Kolla-Ansible) and then marshal the creation of bare-metal compute nodes via the OpenStack Ironic service. The flow looks something like this with the Ansible Control Host being used to configure the OpenStack (via a Bifrost service running on the seed node) as well the configuration of network switches. Github provides the source repositories.

Further Ansible playbooks together with OpenStack Heat permit the deployment of the Slurm platform, based on the latest OpenHPC image and various high performance storage subsystems, in this case using BeeGFS Ansible playbooks. The graphic above depicts the resulting environment with the addition of OpenStack Monasca Monitoring and Logging Service (depicted by the lizard logo). As we will see later on, this provides valuable insight to system metrics (for both system administrators and the end user).
So let us assume that we first want to address the Price-Performance and Price driven markets - at scale we need to be concerned around East-West traffic congestion between switches, where this can be somewhat mitigated by the fact that with modern 100GbE switches we can break-out to 25/50GbE which increases the arity of a single switch and (likely congestion). Of course, this means we need to be able to justify the reduction in bandwidth of the NIC. Of course if the total system only spans a single switch then congestion may not be an issue, although further work may be required to understand end-point congestion.
To test the systems performance I used (my preference) HPCC and OpenFoam as two benchmark environments. All tests used gcc, MKL and openmpi3 and no attempt was made to further optimise the applications. Afterall, all I want to do is run comparative tests of the same binary, by changing run-time variables to target the underlying fabric. For openmpi, this can be achieved with the following (see below). The system uses an OpenHPC image. At the BIOS level, the system has hyperthreading enabled and so I was careful to ensure that process placement ensured I pinned only half the number of available slots (I’m using Slurm) and mapped by CPU. This is important to know when we come to examine the performance dashboards below. Here are the specific mca parameters for targeting the fabrics.
DEV=" roce ibx eth 10Geth"
for j in $DEV;
do

if [ $j == ibx ]; then
MCA_PARAMS="--bind-to core --mca btl openib,self,vader  --mca btl_openib_if_include mlx5_0:1 "
fi
if [ $j == roce ]; then
MCA_PARAMS="--bind-to core --mca btl openib,self,vader  --mca btl_openib_if_include mlx5_1:1
fi
if [ $j == eth ]; then
MCA_PARAMS="--bind-to core --mca btl tcp,self,vader  --mca btl_tcp_if_include p3p2"
fi
if [ $j == 10Geth ]; then
MCA_PARAMS="--bind-to core --mca btl tcp,self,vader  --mca btl_tcp_if_include em1"
fi
if [ $j == ipoib ]; then
MCA_PARAMS="--bind-to core --mca btl tcp,self,vader  --mca btl_tcp_if_include ib0"
fi
In the results below, I’m comparing the performance across each network using HPCC for a size of 8 nodes (up to 256 cores, albeit 512 virtual cores are available as described above). I think this would cover the vast majority of cases in Research Computing.
Results
HPCC Benchmark
The results for major operations of the HPCC suite are shown below together with a personal narrative of the performance. A more thorough description of the benchmarks can be found here.
8 nodes 256 cores
| Benchmark | 10GbE (TCP) | 25GbE (TCP) | 100Gb IB | 25GbE RoCE |
|---|---|---|---|---|
| HPL_Tflops | 3.584 | 4.186 | 5.476 | 5.233 |
| PTRANS_GBs | 5.656 | 16.458 | 44.179 | 17.803 |
| MPIRandomAccess_GUPs | 0.005 | 0.004 | 0.348 | 0.230 |
| StarFFT_Gflops | 1.638 | 1.635 | 1.636 | 1.640 |
| SingleFFT_Gflops | 2.279 | 2.232 | 2.343 | 2.322 |
| MPIFFT_Gflops | 27.961 | 62.236 | 117.341 | 59.523 |
| RandomlyOrderedRingLatency_usec | 87.761 | 100.142 | 3.054 | 2.508 |
| RandomlyOrderedRingBandwidth_GBytes | 0.027 | 0.077 | 0.308 | 0.092 |
- HPL – We can see here that it is evenly balanced between low-latency and b/w with RoCE and IB on a par even with the reduction in b/w of RoCE. In one sense this performance underlies the graphics shown above in terms of HPL, where Ethernet occupies ~50% of the share of total clusters which is not matched in terms of the performance share.
- PTRANS – Performance pretty much in line with b/w
- GUPS – latency dominated. IB wins by some margin
- STARFFT– Embarrassingly Parallel (HTC use-case) no network effect.
- SINGLEFFT – No effect no comms.
- MPIFFT – Heavily b/w dominated see effect of 100 vs 25 Gbps (no latency effect)
- Random Ring Latency – see effect of RDMA vs. TCP. Not sure why RoCE is better that IB, but may be due to the random order?
- Random Ring B/W – In line with 100Gbps (IB) vs 25Gbps (RDMA) vs TCP networks.
OpenFoam
I took the standard Motorbike benchmark and ran this on 128 (4 nodes) and 256 (8 nodes) cores on the same networks as above. I did not change the mesh sizing between runs and thus on higher processor counts, comms will be imbalanced. The results are shown below, showing very little difference between the RDMA networks despite the bandwidth difference.
| Nodes(Processors) | 100Gbps IB | 25Gbps ROCE | 25Gbps TCP | 10Gbps TCP |
|---|---|---|---|---|
| 8/(256) | 87.64 | 93.35 | 560.37 | 591.23 |
| 4/(128) | 99.83 | 101.49 | 347.19 | 379.32 |
Elapsed Time in Seconds. NB the increase in time for TCP when running on more processors!
Future Work
So at present I have only looked at MPI communication. The next big thing to look at is storage, where the advantages of Ethernet need to be assessed not only in terms of performance but also the natural advantage the Ethernet standard has in connectivity for many network-attached devices.
Why OpenStack
As was mentioned above, one of the prototypical aspects of the AlaSKA system is to model operational aspects of the Science Data Processor element of the SKA. More information on the SDP project can be found here <https://developer.skao.int/en/latest/projects/area/sdp.html>.
Using Ethernet, and in particular the use of High Performance Ethernet (HPC Ethernet in the parlance of Cray), holds a particular benefit in the case of on-premise cloud, as infrastructure may be isolated in terms of multiple tenants. For the particular case of IB and OPA this can be achieved using ad-hoc methods for the respective network. For Ethernet, however, multi-tenancy is native.
For many HPC scenarios, multi tenancy is not important, nor even a requirement. For others, it is key and mandatory, e.g. secure clouds for clinical research. One aspect of multi-tenancy is shown in the analysis of the results, where we use the aspects of OpenStack Monasca (multi-tenant monitoring and logging service) and Grafana dashboards. More information on the architecture of Monasca can be found in a previous blog article.
Appendix – OpenStack Monasca Monitoring O/P
HPCC
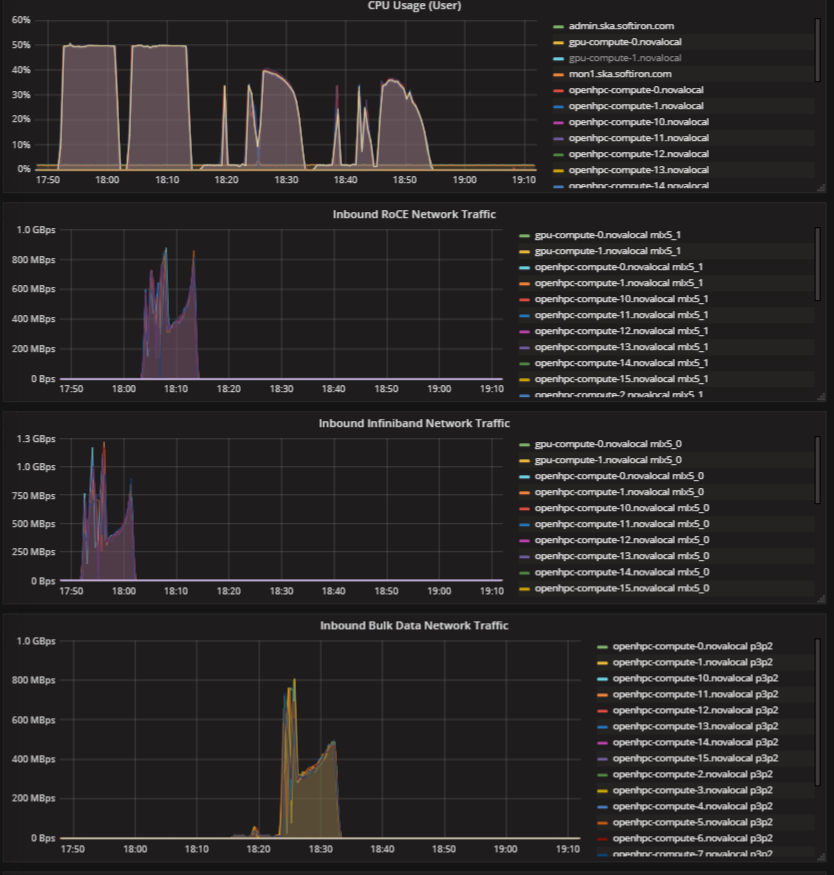
The plot below shows CPU usage and network b/w for the runs of HPCC using a grafana dashboard and OpenStack Monasca monitoring as a service. The 4 epochs are shown for the IB, RoCE, 25Gbps (TCP) and 10Gbps (TCP). The total CPU usage is set at 50% as these are HT-enabled nodes but mapped by-core with 1 thread per core. Thus, we are only consuming 50% of the available resources. Network bandwidth is shown for 3 of the epochs shown. “Inbound ROCE Network Traffic”, “Inbound Infiniband Network Traffic” and “Inbound Bulk Data Network Traffic” – Bulk Data Network refers to an erstwhile name for the ingest network for the SDP.

For the case of CPU usage, a reduction in performance is observed for the TCP cases. This is further evidenced by a 2nd plot that shows the system CPU, showing heavy system overhead for the 4 separate epochs.
