For optimal reading, please switch to desktop mode.

DISCLAIMER: No GANs were harmed in the writing of the blog.
Kubeflow is a machine learning toolkit for Kubernetes. It aims to bring popular tools and libraries under a single umbrella to allow users to:
- Spawn Jupyter notebooks with persistent volume for exploratory work.
- Build, deploy and manage machine learning pipelines with initial support for the TensorFlow ecosystem but has since expanded to include other libraries that have recently gained popularity in the research communitity like PyTorch.
- Tune hyperparameters, serve models, etc.
In our ongoing effort to demonstrate that OpenStack managed baremetal infrastructure is a suitable platform for performing cutting-edge science, we set out to deploy this popular machine learning framework on top of underlying Kubernetes container orchestration layer deployed via OpenStack Magnum. The control plane for the baremetal OpenStack cloud constitute of Kolla containers deployed using Kayobe which provides for containerised OpenStack to baremetal and is how we manage the vast majority of our deployments to customer sites. The justification for running baremetal instances is to minimise the performance overhead of virtualisation.
Apparatus
- Baremetal OpenStack cloud (minimum Rocky) except for OpenStack Magnum (which must be at least Stein 8.1.0 for various reasons detailed later but critically in order to support Fedora Atomic 29 which addresses a CVE present in earlier Docker version).
- A few spare baremetal instances (minimum 2 for 1 master and 1 worker).
Deployment Steps
- Provision a Kubernetes cluster using OpenStack Magnum. For this step, we recommend using Terraform or Ansible. Since Ansible 2.8, os_coe_cluster_template and os_coe_cluster modules are available to support Magnum cluster template and cluster creation. However, in our case, we opted for Terraform which has a nicer user experience because it understands the interdependency between the cluster template and the cluster and therefore automatically determines the order in which they need to be created and updated. To be exact, we create our cluster using a Terraform template defined in this repo where the README.md has details of the how to setup Terraform, upload image and bootstrap Ansible in order to deploy Kubeflow. The key labels we pass to the cluster template are as follows:
cgroup_driver="cgroupfs"
ingress_controller="traefik"
tiller_enabled="true"
tiller_tag="v2.14.3"
monitoring_enabled="true"
kube_tag="v1.14.6"
cloud_provider_tag="v1.14.0"
heat_container_agent_tag="train-dev"
- Run ./terraform init && ./terraform apply to create the cluster.
- Once the cluster is ready, source magnum-tiller.sh to use tiller enabled by Magnum and run our Ansible playbook to deploy Kubeflow along with ingress to all the services (edit variables/example.yml to suit your OpenStack environment):
ansible-playbook k8s.yml -e @variables/example.yml
- At this point, we should see a list of ingresses which use *-minion-0 as the ingress node by default when we run kubectl get ingress -A. We are using a nip.io based wildcard DNS service so that traffic generating from different subdomains map to various services we have deployed. For example, the Kubeflow dashboard is deployed as ambassador-ingress and the Tensorboard dashboard is deployed as tensorboard-ingress. Similarly, the Grafana dashboard deployed by placing monitoring_enabled=True label is deployed as monitoring-ingress. The mnist-ingress ingress is currently functioning as a placeholder for the next part where we train and serve a model using the Kubeflow ML pipeline.
$ kubectl get ingress -A
NAMESPACE    NAME                  HOSTS                           ADDRESS   PORTS   AGE
kubeflow     ambassador-ingress    kubeflow.10.145.0.8.nip.io                80      35h
kubeflow     mnist-ingress         mnist.10.145.0.8.nip.io                   80      35h
kubeflow     tensorboard-ingress   tensorboard.10.145.0.8.nip.io             80      35h
monitoring   monitoring-ingress    grafana.10.145.0.8.nip.io                 80      35h
- Next step is to deploy a ML workflow to Kubeflow. We stepped through the instructions in the README for MNIST on Kubeflow example ourselves and with minimal customisation for use with kustomize, managed to train the model and serve it through a nice frontend. The web interface should be reachable through the mnist-ingress endpoint.
git clone https://github.com/stackhpc/kubeflow-examples examples -b dell
cd examples/mnist && bash deploy-kustomizations.sh
Notes on Monitoring
Kubeflow comes with a Tensorboard service which allows users to visualise machine learning model training logs, model architecture and also the efficacy of the model itself by reducing the latent space of the weights in the final layer before the model makes a classification.
The extensibility of the OpenStack Monasca service also lends itself well to the integration into machine learning model training loops given that the agent is configured to accept non-local traffic on workers which can be done by setting the following values inside /etc/monasca/agent/agent.yaml and a restart of the monasca-agent.target service:
monasca_statsd_port: 8125
non_local_traffic: true
On the client side where the machine model example is running, metrics of interest can now be posted to the monasca agent. For example, we can provide a callback function to FastAI, a machine learning wrapper library which uses PyTorch primitives underneath with an emphasis on transfer learning (and can be launched as a GPU flavored notebook container on Kubeflow) for tasks such as image and natural language processing. The training loop of the library hooks into callback functions encapsulated within the PostMetrics class defined below at the end of every batch or at the end of every epoch of the model training process:
# Import the module.
from fastai.callbacks.loss_metrics import *
import monascastatsd as mstatsd

conn = mstatsd.Connection(host='openhpc-login-0', port=8125)

# Create the client with optional dimensions
client = mstatsd.Client(connection=conn, dimensions={'env': 'fastai'})

# Create a gauge called fastai
gauge = client.get_gauge('fastai', dimensions={'env': 'fastai'})

class PostMetrics(LearnerCallback):

    def __init__(self):
        self.stop = False

    def on_batch_end(self, last_loss, **kwargs:Any)->None:
        if self.stop: return True #to skip validation after stopping during training
        # Record a gauge 50% of the time.
        gauge.send('trn_loss', float(last_loss), sample_rate=1.0)

    def on_epoch_end(self, last_loss, epoch, smooth_loss, last_metrics, **kwargs:Any):
        val_loss, error_rate = last_metrics
        gauge.send('val_loss', float(val_loss), sample_rate=1.0)
        gauge.send('error_rate', float(error_rate), sample_rate=1.0)
        gauge.send('smooth_loss', float(smooth_loss), sample_rate=1.0)
        gauge.send('trn_loss', float(last_loss), sample_rate=1.0)
        gauge.send('epoch', int(epoch), sample_rate=1.0)

  # Pass PostMetrics() callback function to cnn_learner's training loop
  learn = cnn_learner(data, models.resnet34, metrics=error_rate, bn_final=True, callbacks=[PostMetrics()])
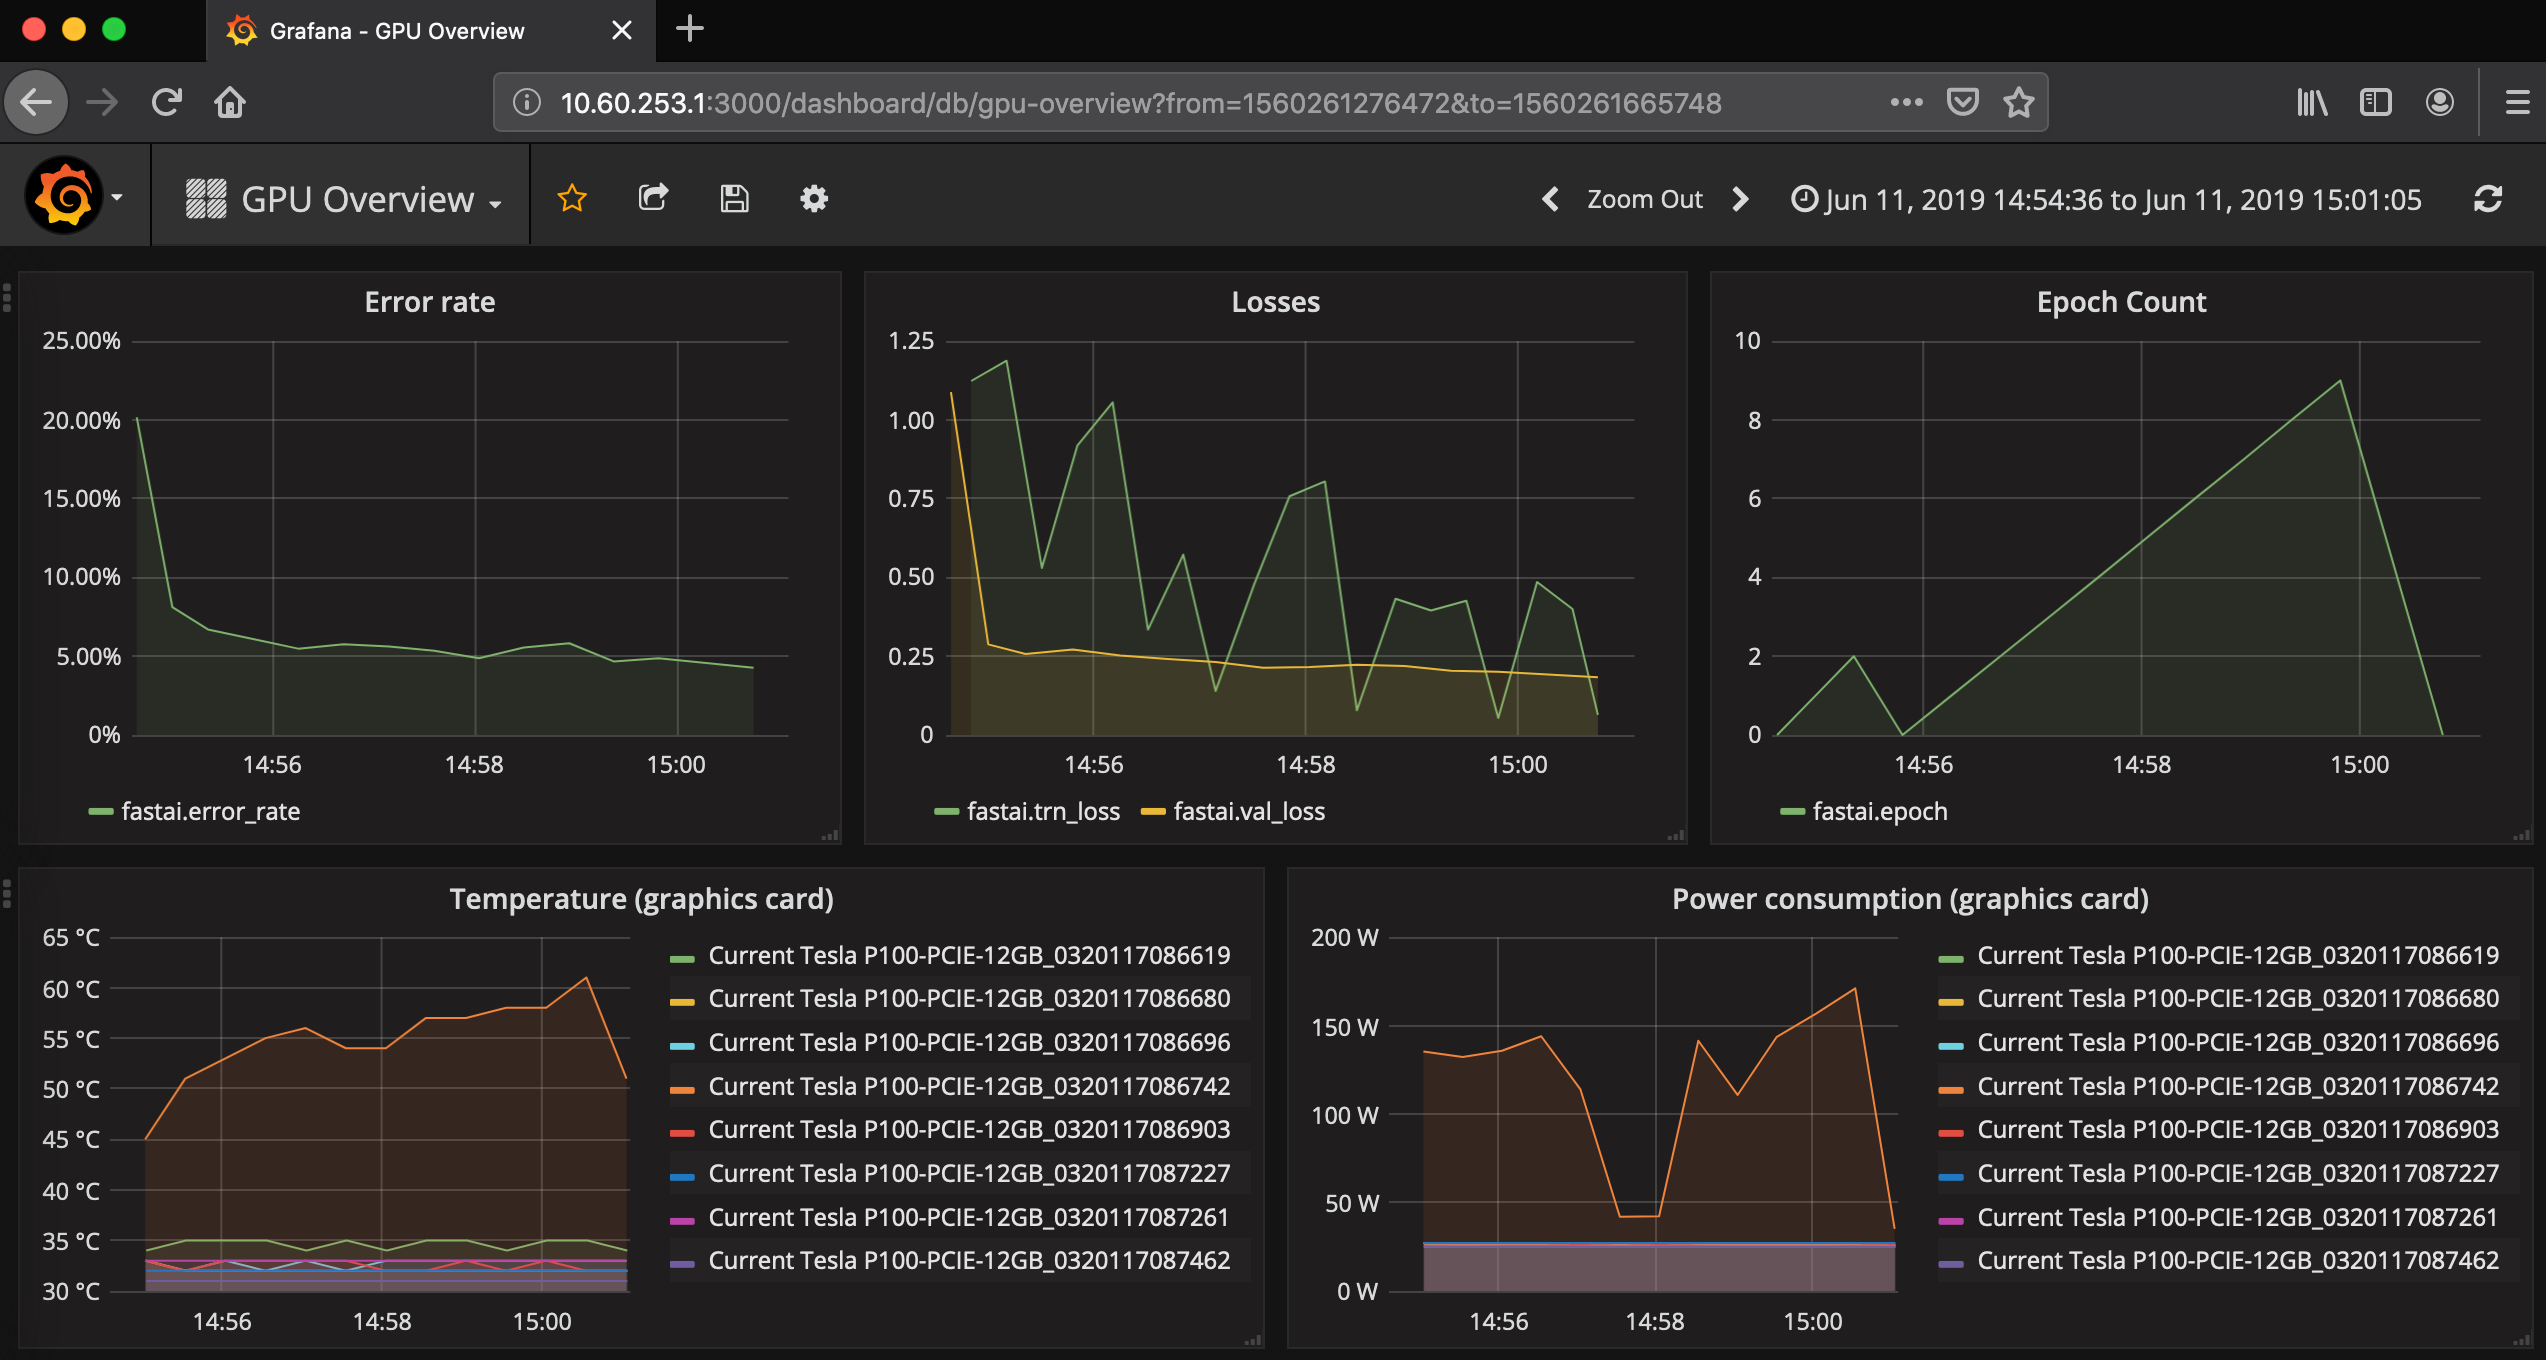
These metrics are sent to the OpenStack Monasca API which can then be visualised on a Grafana dashboard against GPU power consumption which can then allow a user to determine the tradeoff against model accuracy as shown in the following figure:

In addition, general resource usage monitoring may also be of interest. There are two Prometheus based monitoring options available on Magnum:
- First, non-helm based method uses prometheus_monitoring label which when set to True deploys a monitoring stack consisting of a Prometheus service, a Grafana service and a DaemonSet (Kubernetes terminology which translates to a service per node in the cluster) of node exporters. However, the the deployed Grafana service does not provide any useful dashboards that acts as an interface with the collected metrics due to a change in how default dashboards are loaded in recent versions of Grafana. A dashboard can be installed manually but it does not allow the user to drill down into the visible metrics further and presents the information in a flat way.
- Second, helm based method (recommended) requires monitoring_enabled and tiller_enabled labels to be set to True. It deploys a similar monitoring stack as above but because it is helm based, it is also upgradable. In this case, the Grafana service comes preloaded with several dashboards that present the metrics collected by the node exporters in a meaningful way allowing users to drill down to various levels of detail and types of groupings, e.g. by cluster, namespace, pod, node, etc.
Of course, it is also possible to deploy a Prometheus based monitoring stack without having it managed by Magnum. Additionally, we have demonstrated that it is also as option to deploy the Monasca agent running inside of a container to post metrics to the Monasca API which may be available if it is configured to be the way to monitor the control plane metrics.
Why we recommend upgrading Magnum to Stein (8.1.0 release)
- OpenStack Magnum (Rocky) supports up to Fedora Atomic 27 which is EOL. Support for Fedora Atomic 29 (with the fixes for the CVE mentioned earlier) requires a backport of various fixes from the master branch that reinstate support for the two network plugin types supported by Magnum (namely Calico and Flannel).
- Additonally, there have been changes to the Kubernetes API which are outside of Magnum project's control. Rocky only supports the versions of Kubernetes upto v1.13.x and the Kubernetes project maintainers only actively maintain a development branch and 3 stable releases. The current development release is v1.17.x which means v1.16.x, v1.15.x and 1.14.x can expect updates and backport of critical fixes. Support for v1.15.x and v1.16.x are coming to Train release but upgrading to Stein will enable us to support up to v1.14.x.
- The traefik ingress controller deployed by magnum is no longer working in Rocky release due to the fact the former behaviour was to always deploy the latest tag. However, a new major version (2.0.0) has been released with breaking changes to the API which inevitably fails. Stein 8.1.0 has the necessary fixes and additionally, also supports the more popular nginx based ingress controller.
Get in touch
If you would like to get in touch we would love to hear from you. Reach out to us via Bluesky or directly via our contact page.