For optimal reading, please switch to desktop mode.
Recently we discussed our stackhpc.openhpc Ansible Galaxy role which can deploy a Slurm cluster based on the OpenHPC project. Using that role as a base, we have created a "Slurm appliance" which configures a fully functional and production ready HPC workload management environment. Currently in preview, this set of Ansible playbooks, roles and configuration creates a CentOS 8 / OpenHPC v2 -based Slurm cluster with:
- Multiple NFS filesystems - using servers both within or external to the appliance-managed cluster.
- Slurm accounting using a MySQL backend.
- A monitoring backend integrated with Slurm using Prometheus and ElasticSearch.
- Grafana with dashboards for both individual nodes and Slurm jobs.
- Production-ready Slurm defaults for access and memory.
- Post-deploy MPI-based tests for floating point performance, bandwidth and latency using Intel MPI Benchmarks and the High Performance Linpack suites.
- A Packer-based build pipeline for compute node images.
- Slurm-driven reimaging of compute nodes.
The "software appliance" moniker reflects the fact it is intended to be as "plug-and-play" as possible, with configuration only required to define which services to run where. Yet unlike e.g. a storage appliance it is hardware agnostic, working with anything from general-use cloud VMs to baremetal HPC nodes. In addition, its modular design means that the environment can be customised based on site-specific requirements. The initial list of features above is just a starting point and there are plans to add support for identity/access management, high-performance filesystems, and Spack-based software toolchains. We fully intend for this to be a community effort and that users will propose and integrate new features based on their local needs. We think this combination of useability, flexibility and extendability is genuinely novel and quite different from existing "HPC-in-a-box" type offerings.
The appliance also supports multiple environments in a single repository, making it simple to manage differences between between development, staging and production environments.
Future blogs will explore some of these features such as the Slurm-driven reimaging. For now, let's look at the monitoring features in more detail. The appliance can deploy and automatically configure:
- Prometheus node-exporters to gather information on hardware- and OS-level metrics, such as CPU/memory/network use.
- A Prometheus server to scrape and store that data.
- A MySQL server and the Slurm database daemon to provide enhanced Slurm accounting information.
- OpenDistro's containerised ElasticSearch for archiving and retrieval of log files.
- Containerised Kibana for visualisation and searching with ElasticSearch.
- Containerised Filebeat to parse log files and ship to ElasticSearch.
- Podman to manage these containers.
- Tools to convert output from Slurm's sacct for ingestion into ElasticSearch.
- Grafana to serve browser-based dashboards.
That's a complex software stack but to deploy it you just tell the appliance which host(s) should run it. This gives cluster users a Grafana dashboard displaying Slurm jobs:

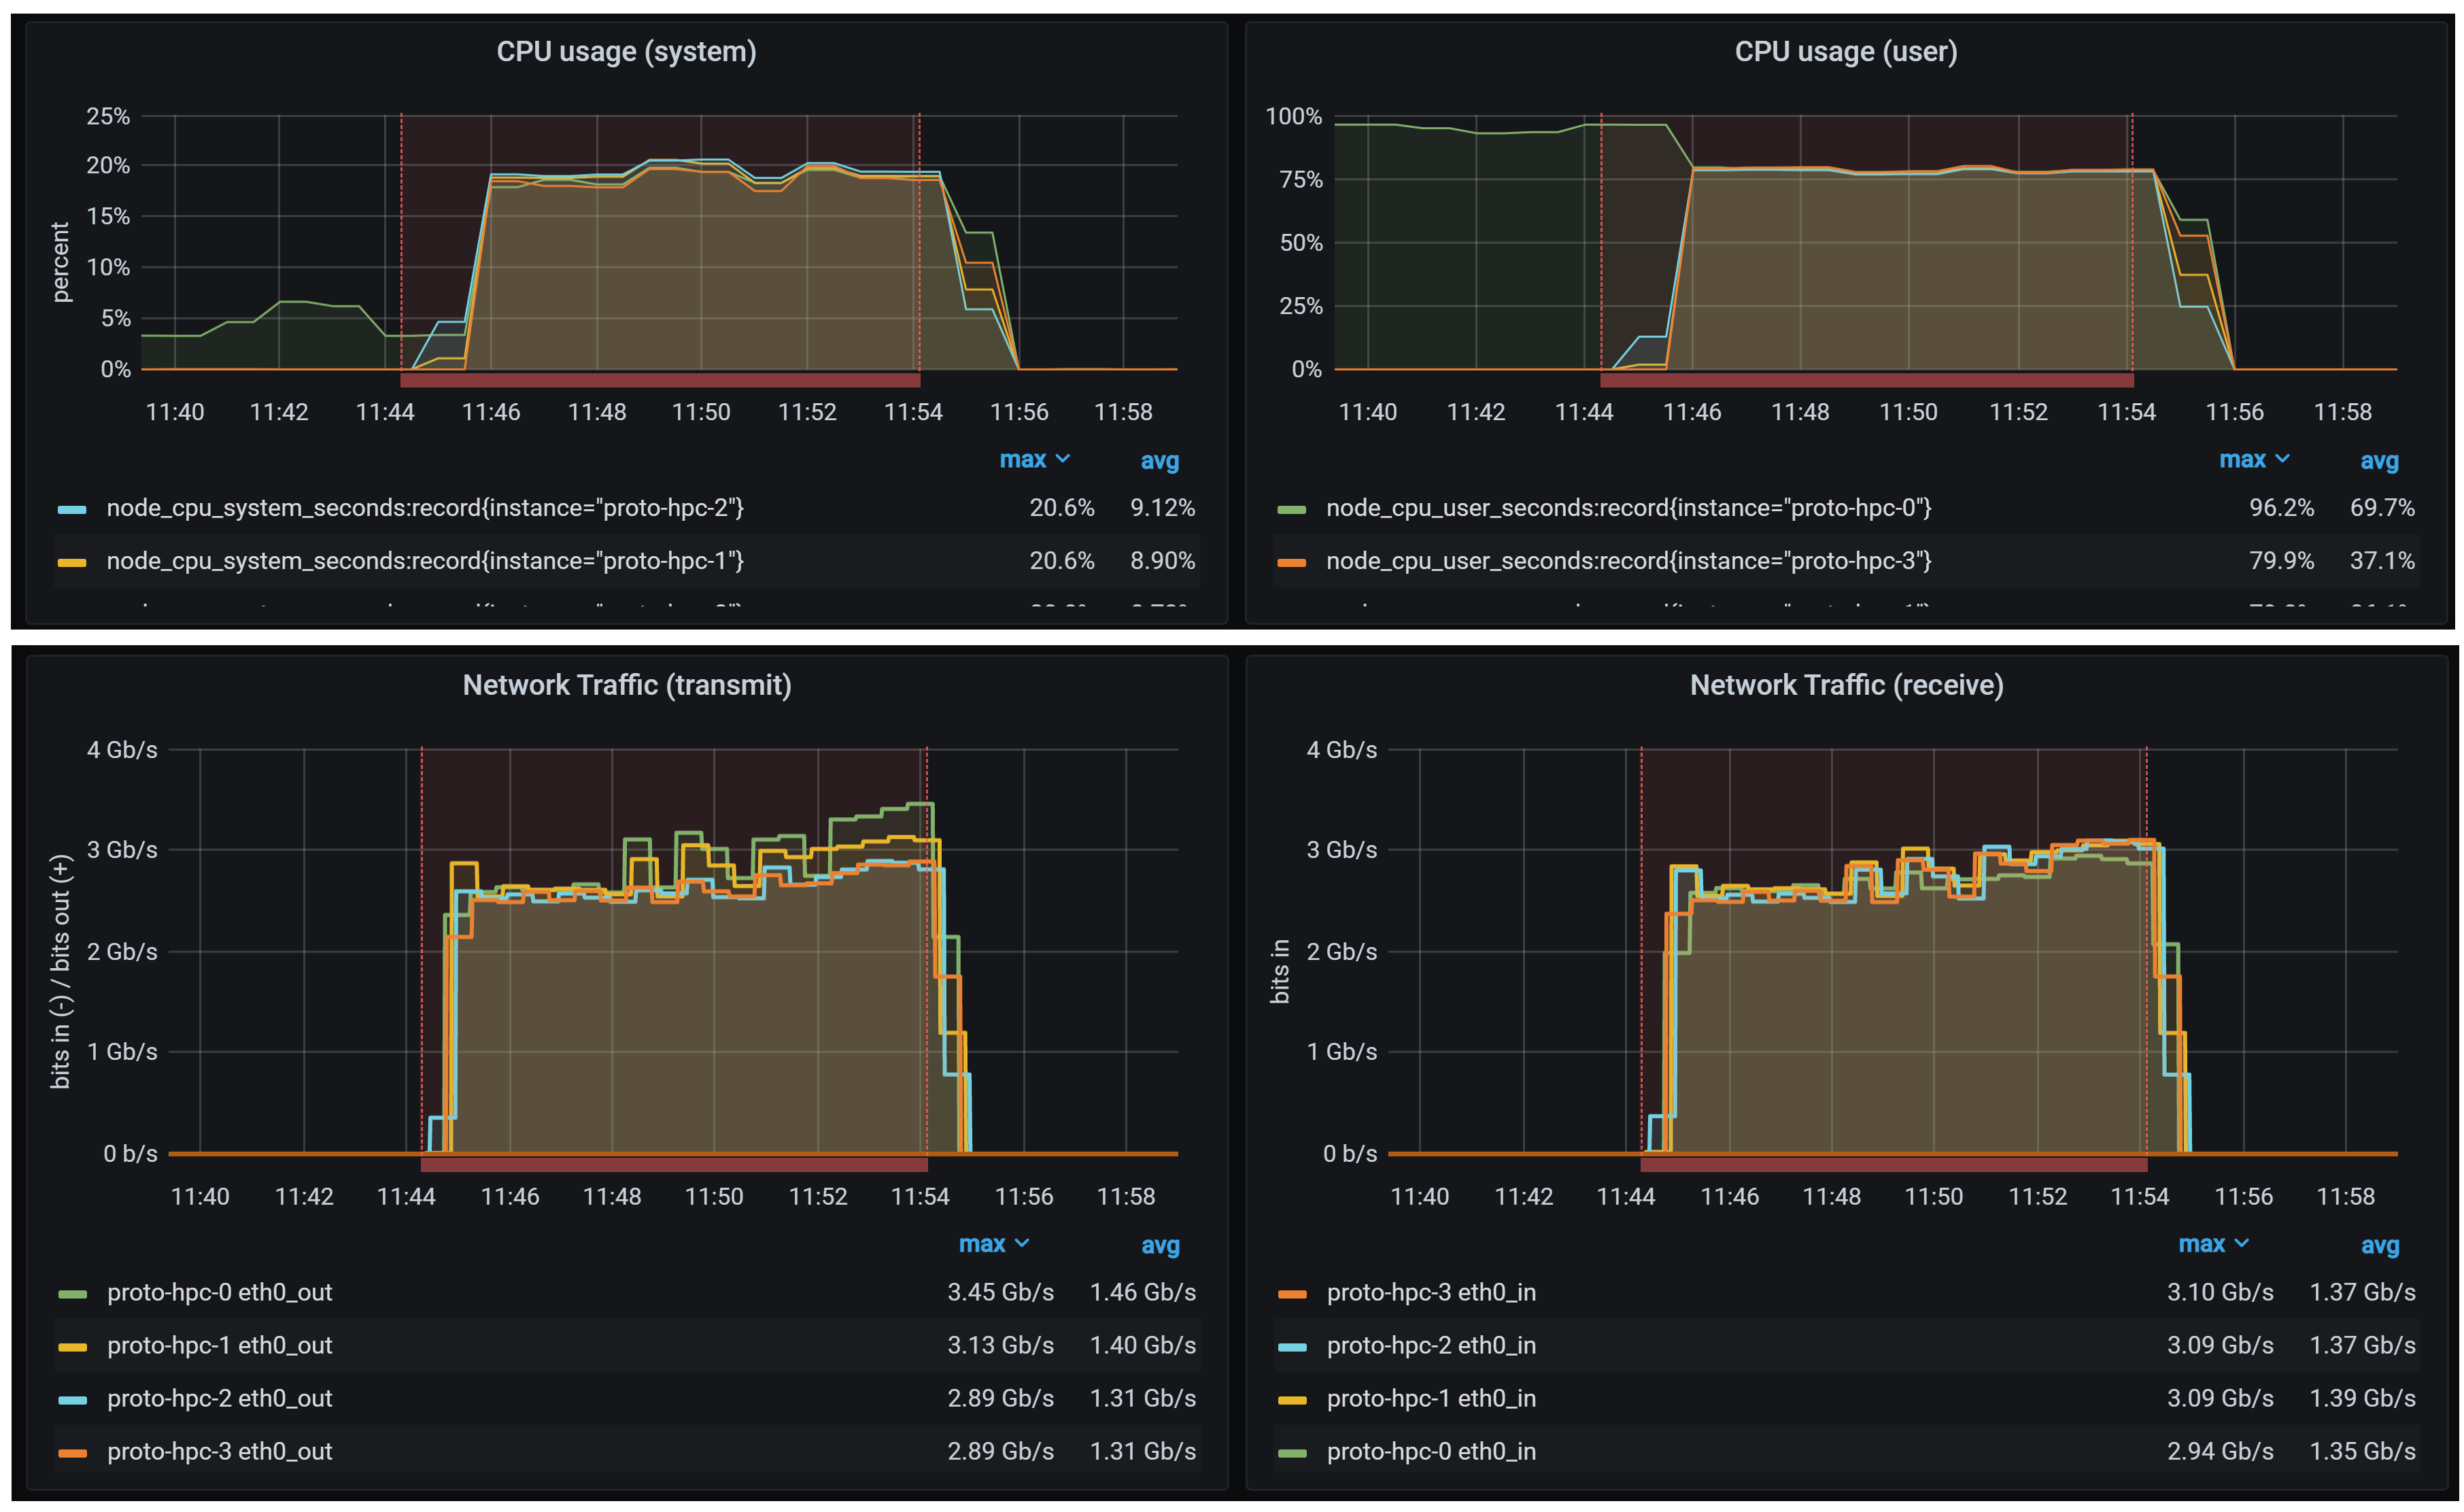
Clicking on a job shows a job-specific dashboard which aggregates metrics from all the nodes running the job, for example CPU and network usage as shown here:

Moving on to the post-deployment tests, these have proved to be a useful tool for picking up issues, especially in combination with the monitoring. Getting an MPI environment working properly is often not straightforward, with potential for incompatilities between the selected compiler, MPI library, MPI launcher and scheduler integration and batch script options. The key here is that these tests deploy a "known-good" software stack using specific OpenHPC- and Intel- provided packages with pre-defined job options. These tests therefore both ensure the other aspects of the environment work as expected (hardware, operating system and network issues) and provide a working baseline MPI configuration to test alternative MPI configurations against. Four tests are currently defined:
Intel MPI Benchmarks PingPong on two (scheduler-selected) nodes, providing a basic look at latency and bandwidth.
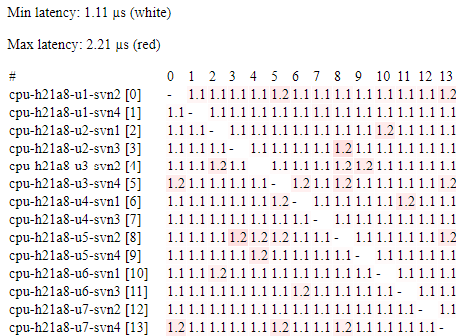
A "ping matrix" using a similar ping-pong style zero-size message latency test, but running on every pair-wise combination of nodes. As well as summary statistics this also generates a heat-map style table which exposes problems with specific links or switches. The results below are from a run using 224 nodes in four racks - differences between intra- and inter-rack latency are clearly visible.

Start of results (larger image).

Larger extract (larger image).
High Performance Linpack (HPL) on every node individually, to show up "weak" nodes and provide a measure of single-node performance.
HPL using all nodes individually, to test the impact of inter-node communications.
Larger extract from ping matrix - fullsize image.
Many papers have been written on selecting optimal parameters for HPL but here only the processor-model-specific block size "NB" needs to be set, with selection of all other parameters being automated. The sustained use of all processor cores in these tests also provides quite a severe stress test for other aspects of the environment such as cooling.
Early versions of this Slurm appliance are in production now on various systems. We plan for it to gradually replace earlier client-specific codebases as we upgrade their Slurm clusters. Not only will this commonality make it possible for us to spend more time adding new features, it will make it much easier for us to bring fixes and new features to those deployments.
Get in touch
If you would like to get in touch we would love to hear from you. Reach out to us via Bluesky or directly via our contact page.